Shiny Application to analyse graduates per country and year
I have created a Shiny application that shows data from the Organisation for Economic Co-operation and Development (OECD) concerning graduates and population per Country and Year. OCDE is an international economic organisation of 34 countries, it publishes statistics on a wide number of subjects.
The original file from OECD for graduates is on the address: OECD Graduates
The original file from OECD for Population is on the address: OECD Population
The dataset on graduates counts the International Standard Classification of Education (ISCED) levels, starting from level 3, which is upper secondary education.
The dataset on population contains a mid-year population data for the 34 OECD member countries.
The datasets are subset to contain the last five years of data, resulting in years 2008 until 2012. Since the graduates did not contain data on all of the 34 OECD member countries, the datasets are merged to keep only the 29 countries in common.
This repo contains two files for the datasets and two files for the source code. The two files for the dataset are copied in the repo and available in the OECD pages listed above. The two files for the source code are:
ui.R - contains one component, which is a select box used to select the year and a space to dynamically place the generated charts. server.R - reads and manipulates the data. At first, it presents the two charts for all the years from 2008 until 2012. Then, dynamically updates the two charts based on the user selection of the year. Here is data from the resulting dataset merging graduates and population:
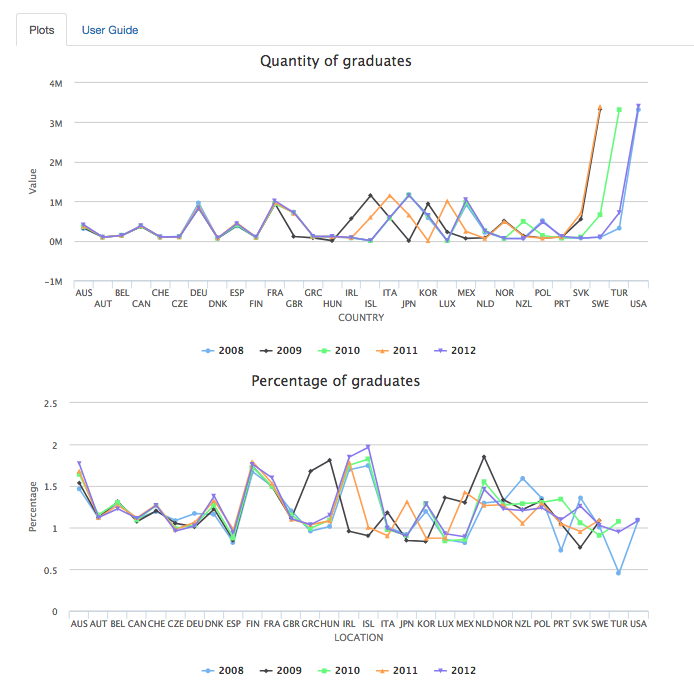
The first chart shows the quantity of graduates per country and year.
The second chart shows the percentage of graduates per country and year. The percentage is calculated based on the number of graduates and population. Population is needed to provide proportionality, a corrective measure to give fairness to the statistics when analysing the countries with more graduates. For instance, with quantity, the USA has a high number of graduates due to its large population. But with proportionality, we see that Ireland, Finland and Austria have a higher proportion of graduates than the USA, to name a few.
The Shiny application is available at: OECD Graduates Shiny Application
Shiny application that shows two charts with the quantity and percentage of graduates per country and year (Data source: OECD).
At first, it presents the two charts for all the years from 2008 until 2012.
Then, it dynamically updates the two charts based on the user selection of the year.
You can pass the mouse over the lines to see the country, year and value.
The source code are available on my GitHub Repo for OECD Graduates: OECD Graduates GitHub
Recent Posts
-
Two Books and an Invitation to Learn about Systems Thinking
-
Books I read in 2025
-
Designing Agentic Systems with People in Mind
-
Using a Process Mindset to Drive Innovation with Agentic AI
-
Is Generative AI Weakening Our Critical Thinking?
-
Embracing the AI Shift: Copilot and the New Era of Work
-
Product Owner and Process Engineer
-
What I read in 2024
-
The Science of Choice
-
Rolling out Enterprise Architecture
-
7 Steps to Create Processes
-
First thoughts on Prediction Machines
-
The woman I am
-
Becoming a Runner
-
Business Process Overview